|
|
||
|
|
FORUM:
|
||||||||||||||||||||||||||||||||||||||||||||||||||||||||||||||||||||||||||||||||||||||||||||||||||||||||||||||||||||||||||||||||||||||||||||||||||||||||||||||||||||||||||||||||||||||||||||||||||||||||||||||||||||||||||||||
Port Cities in the Maps of Herman Moll, 1700–1730Alex Zukas
|
||||||||||||||||||||||||||||||||||||||||||||||||||||||||||||||||||||||||||||||||||||||||||||||||||||||||||||||||||||||||||||||||||||||||||||||||||||||||||||||||||||||||||||||||||||||||||||||||||||||||||||||||||||||||||||||
|
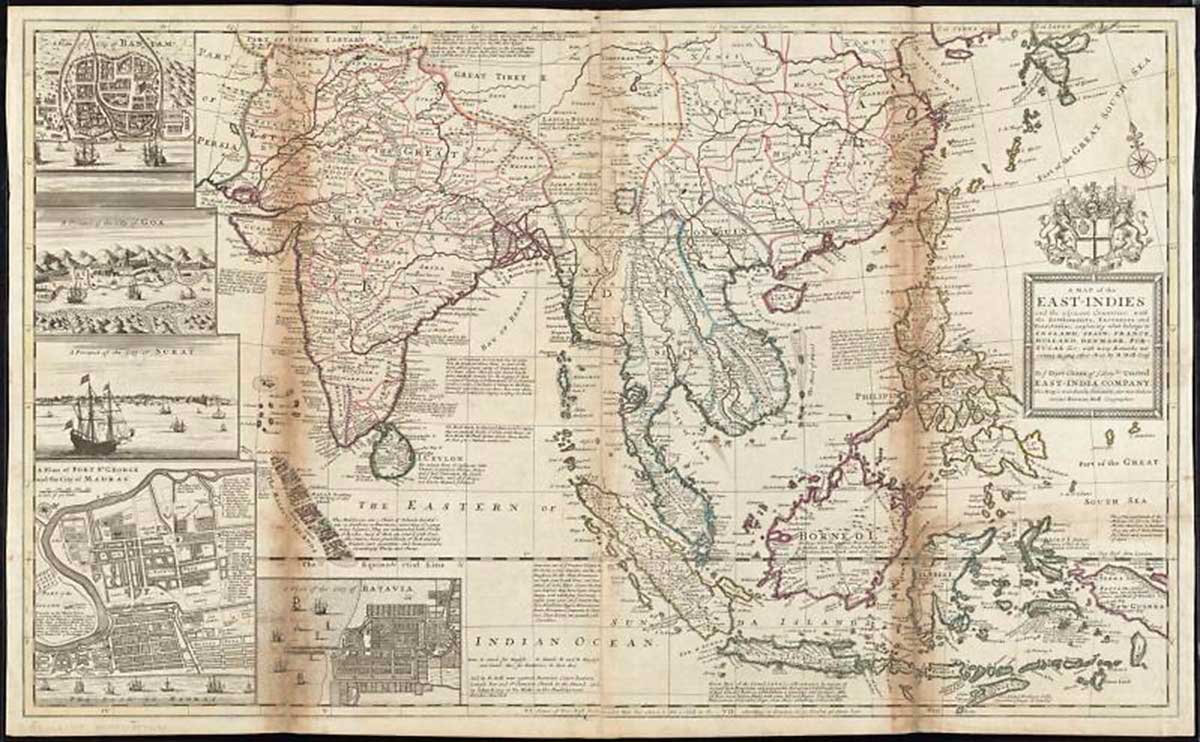
Port cities figured prominently in Herman Moll's eighteenth-century maps of world and regional landmasses. Geographer to the King and the foremost British mapmaker of his day,1 Moll's keen cartographic interest in certain areas of the world made sense once these landmasses and the resources they harbored were visualized in the wider context he intended: their availability to British economic and political interests via port cities and the "world ocean." Sometimes his enlarged views of ports took up twenty-five per cent of a map's surface and even when they were smaller they still commanded the viewer's attention. Representing in cartographic terms a widespread notion among British elites in the early eighteenth century that British economic growth depended on reliable access to the world's resources,2 Moll (ca. 1654–1732) consciously mapped oceans as aqueous highways that allowed British commercial and political contact with every region of the world but he paid particular attention to the harbors, coasts, and port cities of the Americas and the East Indies.3 The wind currents, the seascapes, and the views of ships, entrepôts, citadels, and maritime activity that he inscribed on his maps provided important symbolic and visual clues for interpreting the more visually commanding terrestrial shapes he drew. Those clues highlighted the importance of port cities for Britain's involvement with the nether parts of the world and for altering the global economic and political status quo to Britain's advantage, clues that teachers can help students decode in the classroom. Moll engraved world, continental, regional, and national maps for geography books, pirate memoirs, and novels but his most detailed works were the double-sheet maps he engraved on large copper plates for his atlas, The World Described.4 First published in 1715, Moll expanded and reissued the atlas up until his death in 1732 and it continued to be reissued in different editions through the early 1780s.5 Noted historian of cartography David Woodward called The World Described "the best general atlas of the period"6 and we will examine how Moll represented port cities and oceans in four maps from this atlas: a map of the East Indies, a map of North America, a map of South America, and a world map. We will also consult three influential texts of the periods for which Moll engraved the maps to situate his representation of these port cities in the wider geographical and political thought of his time. East Indian Ports Inset views of port cities along its left and bottom edges occupied about twenty-five percent of the surface of Moll's "A Map of the East Indies," a clear visual clue of the great economic importance of these cities which, from top to bottom, were Bantam, Goa, Surat, Madras, and Batavia. As mere dots on the coasts of India and Java, they would appear insignificant to a map reader in relation to continental and insular landforms.
What the map communicated is that their economic, cultural, and political significance had little to do with their geographic size. What was important was their status as trading centers and depots that permitted access to the commodities produced in the hinterlands. The question remains, though, of the scores of Indian Ocean port cities and littorals he could have portrayed, why did he choose to depict these? The short answer is that these major oceanic ports were also significant political and administrative centers.
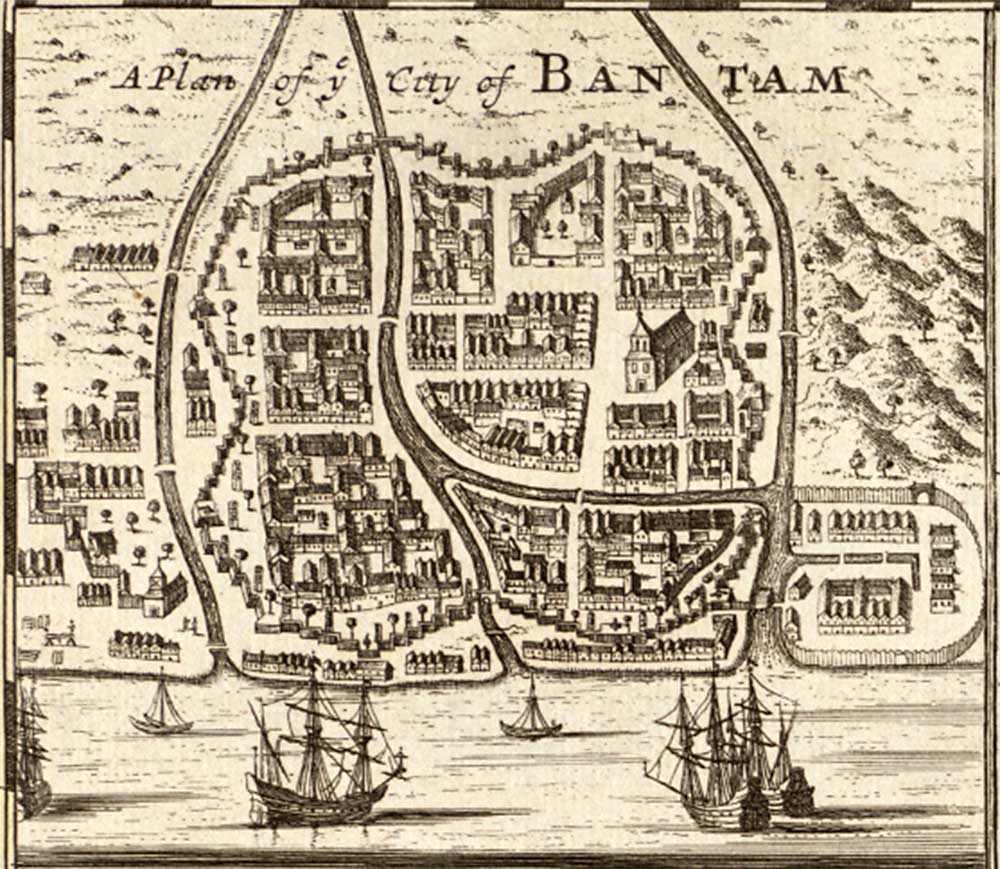
Bantam (Banten today) was the capital of a kingdom with the same name that had fallen under Dutch "protection" in the late seventeenth century. It was the principal Javanese port for the pepper trade with Europe and lay about 20 miles west of the Dutch colony of Batavia at the delta of the Cibanten River. This bird's-eye view, copied from Joan Blaeu's 1662 Atlas Major, showed a palisade around the city. An inland harbor, replete with warehouses and its own palisade, lay to the city's west. Buildings and streets were neatly arranged and armed European ships (East Indiamen) lay at anchor in the "road" or littoral outside the city. Smaller indigenous craft operated closer to shore and ferried goods from the ocean-going vessels to the warehouses. A 1701 geography for which Moll engraved the maps noted that "The other remarkable places on [Java] are Bantam, the metropolis of a Kingdom of the same Name . . . where the King keeps his Court; being a most noble Mart-Town with a fine Harbour call'd Sunda, to which Merchants resort from all Parts of India, as also from England, Portugal, and Holland."7 A later geography for which Moll engraved the maps added more critical commentary but continued to acknowledge the commercial and strategic importance of the port.8
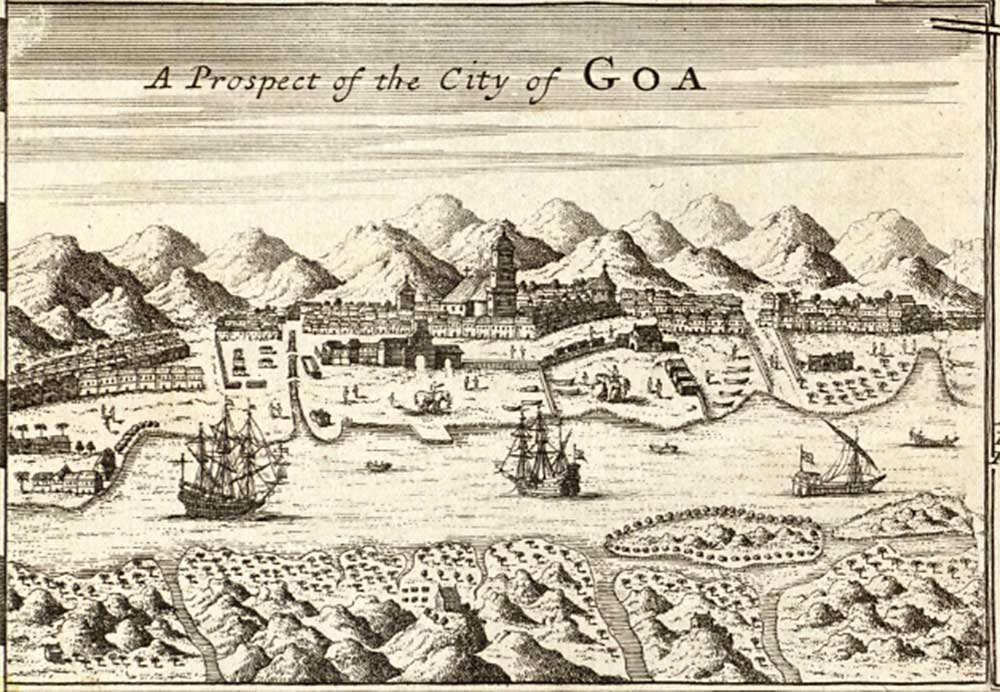
Moving down the views we come to Goa, the capital of Portuguese Asia. It lay on the west coast of India and this oblique view of the port showed East Indiamen at anchor offshore with smaller craft called "lighters" navigating between ships in the foreground and the shore in the background. A dhow on the right side, used for intra-Indian Ocean trade, flew the Union Jack. Unlike Bantam, the port was open and fortifications around the city were minimal. The port area was flat and featureless but there were warehouses, a structure resembling a pier, and elephants in the center of the inset view supplying the muscle power to offload and move goods. Moll would have been familiar with 1701 geography's description of Goa: it sat on an island upriver from the ocean, possessed a "commodious" harbor, and "is adorn'd with many sumptuous Buildings, fair Streets, abundance of Churches and Convents; and though its Walls be slight, the Island is so well guarded by Forts, that the Place is reckon'd the strongest in India."9 The seat of the viceroy and supreme judicature of Portuguese Asia and the anchor of a Portuguese colonialism, it provided unrivaled access to regional foodstuffs, cotton, cotton textiles, diamonds, and other precious stones that made their way to export markets in Europe, Africa, and other parts of Asia.10
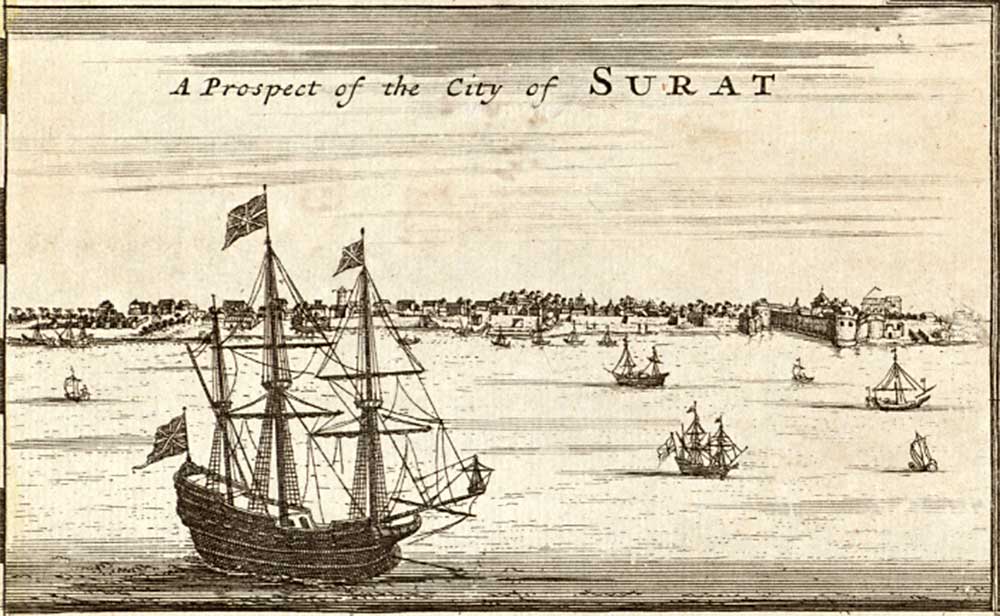
Surat, located on the west coast of India north of Goa, was the main Mughal seaport on the Indian Ocean and the site of an imperial mint.11 All major European states had factories (trading posts) there. As in the view of Goa, East Indiamen were at anchor in the foreground well away from shore at "Swalley Road" and smaller ships ferried goods to and from the shore. In this profile view the fortress of Surat was on the right and the port and warehouses were visible through the rigging of the large ship in the foreground. The city walls extended to the port, which lay outside the city walls but was easily protected by the citadel's cannons. The 1701 geography remarked that Surat was "a large, populous, and rich City surrounded with a good Wall, and guarded by an old Castle . . . The City is guarded by 1500 Soldiers besides the Garison [sic] and Governor in the Castle, and 30 or 40 peices [sic] of Ordinance . . . The [East India] Company's Affairs are manag'd here by a President and Council, who direct and govern the Factories" on the west side of India. The geography warned that the littoral was dangerous because "The [harbor] has a Barr of Sand cross it, so that the Ships of greater Burthen are fain to lye . . . about 4 Leagues from the Town."12 The 1709 geography added that "The Walls, altho' new built are weak . . . The Castle is square, with round Bastions, seated at the South end of the Town . . . the City is a place of vast Traffick for all sort of Indian, Chinese and European commodities," particularly cotton-cloth, porcelain, diamonds, rubies, pearls, other precious stones, spices, fruits, and drugs.13
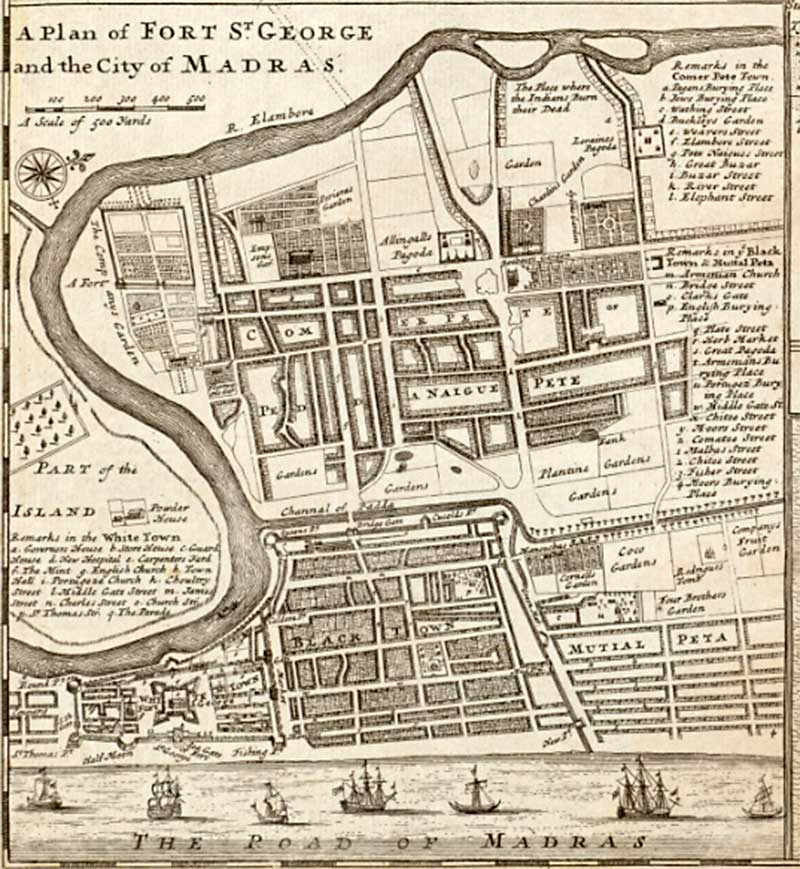
Moll's view of Madras was larger than the other views and occupied the bottom left corner of the map. Madras lay on the Coromandel Coast of southeast India and was one of the three "presidencies" or administrative centers of the British East India Company. This detailed plan or orthogonal view, which appears to be Moll's original work, showed the social and political divisions in the town and its military layout. "White Town" occupied the lower-left corner of the inset. It had a stone wall around it and enclosed Fort St. George with its four pointed bastions. White Town housed Europeans, company soldiers, government buildings, and the mint. "Black Town" had an earthen wall on three sides (not the ocean-facing side) and housed non-European and indigenous people while "Comer Pete Town" was a more recently developed indigenous quarter where the company kept horticultural sites. A location key identified the structures within White Town, Black Town, and Comer Pete Town and a scale of distance in hundreds of yards below the title of the plan allowed viewers to gauge the size of the city. Madras did not have a sheltered harbor. It possessed an open roadstead and the view showed European ships anchored about a quarter mile offshore in "The Road of Madras" with the small local lighters called "Masula boats" ferrying goods between oceangoing ships and sandy shore. The 1701 and 1709 geographies mentioned that Coromandel had a lively import and export business with the inhabitants producing and selling cotton textiles in exchange for foreign goods and "The Coast has many commodious havens, which makes it a Place of great Traffick; but the Ports are mostly in the Hands of Europeans." The geographies emphasized the strong curtain walls, bastions, and ordnance of the city and fort. The geographies concluded by noting that White Town was nearly impregnable and that the English had a trading post there since 1639 by agreement with the King of Golconda to whom they paid an annual tribute (rent, really).14
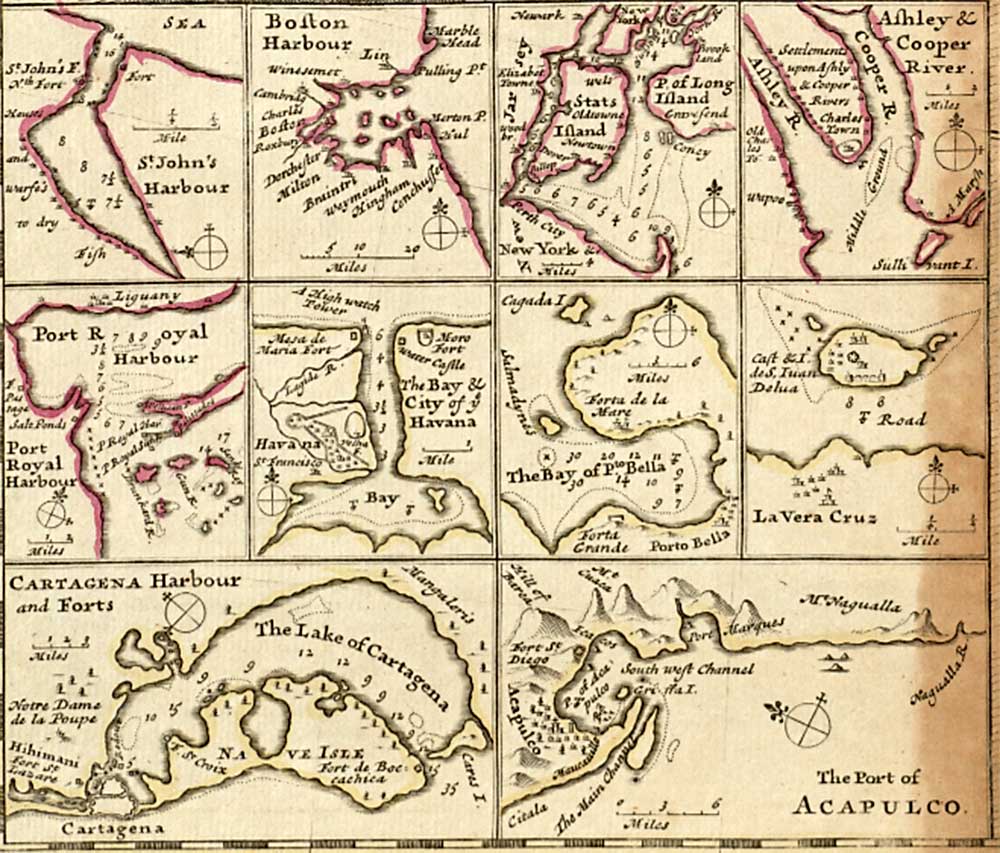
Batavia was the capital of the Dutch East India Company in Asia and Moll's copy of this plan view from a 1669 map by Arnoldus Montanus showed an orderly grid layout of the city and port with ships anchored offshore and small agricultural plots outside the city walls. A moat, made by diverting water from the river that flowed through the middle of the city, surrounded the city walls. Built on canals like Amsterdam, the company's wharves were across the river from the fortress, which nestled between the coast and the river delta. Lighters moored in a specially dug basin outside the city wall. The harbor was fashioned out of the river's delta and sat under the watchful gaze of the soldiers in the citadel. The 1701 geography commented that Batavia was a flourishing Dutch colony, the center of which was a large, neat, populous and well-fortified city, famous for its citadel and the presence of the governor of the Dutch East India Company, "who keeps a most magnificent and almost Royal Court." The geography remarked that the town withstood attacks and sieges by indigenous princes, the King of Mataran and the King of Bantam, around 1660 while the 1709 geography added that its "Houses are neat, and the publick Buildings very Magnificent . . . 'tis a rich and flourishing Mart-Town, resorted to by the Chinese and other Eastern Nations."15 While these East Indian ports were quite different in terms of layout and design, they shared some commonalties besides being adjacent to a body of water. All of the port cities on Moll's map were administrative, political, and military centers as well as international commercial and financial hubs. They concentrated goods and wealth which in turn required extensive defenses against attack. Trade was armed trade in the age of mercantilism16 and all of these port cities had fortified harbors. Their populations were multiethnic and multinational as were the merchants who frequented or resided in the ports. In notations in the countryside and oceans that ringed these cities Moll called attention to valuable commodities shipped from their wharves. He noted "Pepper" on the islands of Sumatra, Borneo, and Java in the vicinity of Bantam and Batavia. "Pepper Mountains," "Diamond mines," and "Visapour, a great Market for Diamonds" turned up on the map east of Goa. Diamond mines were west and northwest of Madras. Along with cotton textiles, especially calicoes, diamonds were a major export of the Coromandel region and Madras. Early-modern ports in the Indian Ocean not only served as gateways for exporting commodities produced in local hinterlands, they also concentrated goods from regions further away like China and Europe. Closer to home, through force of arms, the Dutch monopolized the trade in cloves, nutmeg, and other rare seasonings from "Spice Islands" in the seventeenth century, thereby forcing traders who coveted those spices to acquire them exclusively in Batavia, a location fifteen hundred miles away from the source of these spices. North American and West Indian Ports As an enhancement to his "Map of North America," Moll engraved orthographic or plan views of ten bays in North America and the Caribbean in the lower left-hand corner of the map. Each bay was the location of a major port city and harbor. Five of the port cities were British (St. John's, Boston, New York, Charleston, and Port Royal) and five were Spanish (Havana, Portobello, Vera Cruz, Cartagena, and Acapulco). These plan views did not resemble the views of port cities that Moll engraved on his map of the East Indies. The inset views on the North American map did not show structures or harbor scenes or ships. Moll engraved the insets in the style of navigational charts complete with numbers on some of the charts representing depth soundings in fathoms. As an aid to navigation, each chart had a compass rose oriented to magnetic north, a scales in miles to judge distance, dotted lines indicating sand bars, an "x" indicating underwater hazards like rocks at Port Royal and Vera Cruz, and the names of major land formation near or inside the bays and estuaries. Moll identified the major port city in each bay and occasionally smaller towns in the vicinity. Moll indicated prominent fortifications for those port cities that were on the periphery of British control (St. John's in Newfoundland,
Charleston in Carolina, and Port Royal in Jamaica). At St. John's, forts guarded both sides of the inlet to the harbor while the main fort at Port Royal stood guard over the harbor itself and Charleston was surrounded by a city wall. Although St. John's was an isolated port and not an emporium in the sense that East Indian port cities were, it was a valued port city for another reason: it was the center of the highly lucrative cod fishing trade. Moll indicated the commodity most valued here, one traded to Spain and Portugal for gold which the English then used to purchase East Indian commodities,17 when he noted on the north shore of St. John's Bay, "Houses and warfe's [sic] to dry Fish." The rich fisheries had been contested by the Dutch, French, and British in the seventeenth century until Britain gained control of the island in the Treaty of Utrecht (1713) which wound down the War of the Spanish Succession (1701–1714).
St. John's got passing mention in the 1701 and 1709 geographies but they describe the port city of Boston in glowing terms as a seat of provincial government, a true city with "uniform Streets, and fair Houses, inhabited by Merchants and Tradesmen; who maintain a great Commerce to Barbadoes, and the other Plantations in America; as also to England and Ireland." The geographies claimed fortifications existed on hills outside the city and on an island in the "capacious" harbor and that three to four hundred ships docked in Boston annually and took on loads of lumber, fish, beef, and pork.18 The geographies mentioned that the port city of New York had a significantly smaller population than Boston but was also a seat of provincial government. Again, they identified bastions that protected the city which Moll did not place on his map. New York's greatest export commodity was animal pelts, especially beaver, otter, bear, deer, and elk supplied mostly by local Native Americans and shipped to Britain.19 The geographies identified Charleston as the principal port and city of the new colony of Carolina and the seat of its government. All commodities exported from Carolina, such as rice, indigo, fish, timber, buckskin, and beef, passed through Charleston whose harbor was shallow and could only accommodate ships below two hundred tons.20 Port Royal's harbor, by contrast, was "safe and commodious" and could accommodate larger ships even after the earthquake of 1692. Through it passed the many valuable commodities that the island produced (with slave labor) for export including sugar, cocoa, indigo, cotton, hides, cochineal, ginger, and all-spice. It ceased to be the colony's capital after the earthquake and was not a pleasant place to live due to a dearth of wood, fresh water, and compact soil but, reminiscent of its description of East Indian port cities, the 1701 geography contended that "The Town is a famous Mart, and the Seat of all the Trade in the Isle; being inhabited upon that account, by Merchants, Factors, Vintners and Victuallers, and frequented by Traders of all sorts."21 As described in the 1709 geography, Port Royal was, like many port cities in the East Indies, a transit hub: "Besides the Trade to Europe, there was another far more beneficial from Jamaica to the Spanish American dominions, for Blacks and English Manufactures, which brought in very considerable Sums."22 This lucrative trade in human beings and manufactured goods from other continents had been interrupted by the War of the Spanish Succession which, however, offered the British other means of accumulating wealth: state-licensed raiding (privateering) of the Spanish treasure fleets that annually plied the Caribbean and the Pacific Ocean and dropped anchor at the five Spanish port cities Moll engraved on his map. These port cities had been targets of Dutch, French, and British privateers and pirates since the sixteenth century but the intensity of raids increased after 1650 and became part of the normal apparatus of war as the Netherlands, France, England, and even Spain issued letters of marque that provided legal authorization for privately-owned ships and their crews to attack and seize foreign vessels during wartime. If trade was armed trade in the age of mercantilism, armed conflict was profitable business that took aim at port cities. If one was in doubt, Moll's map dispelled any uncertainty. It was a privateer's map engraved and printed to encourage British adventurers to participate in the war effort and strike it rich.
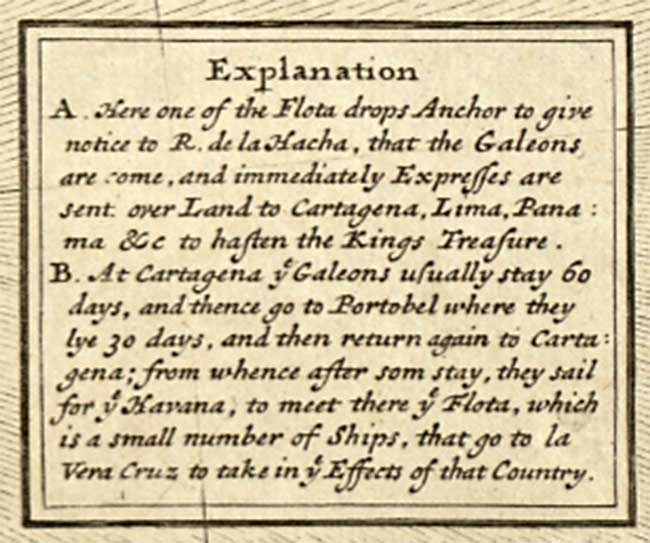
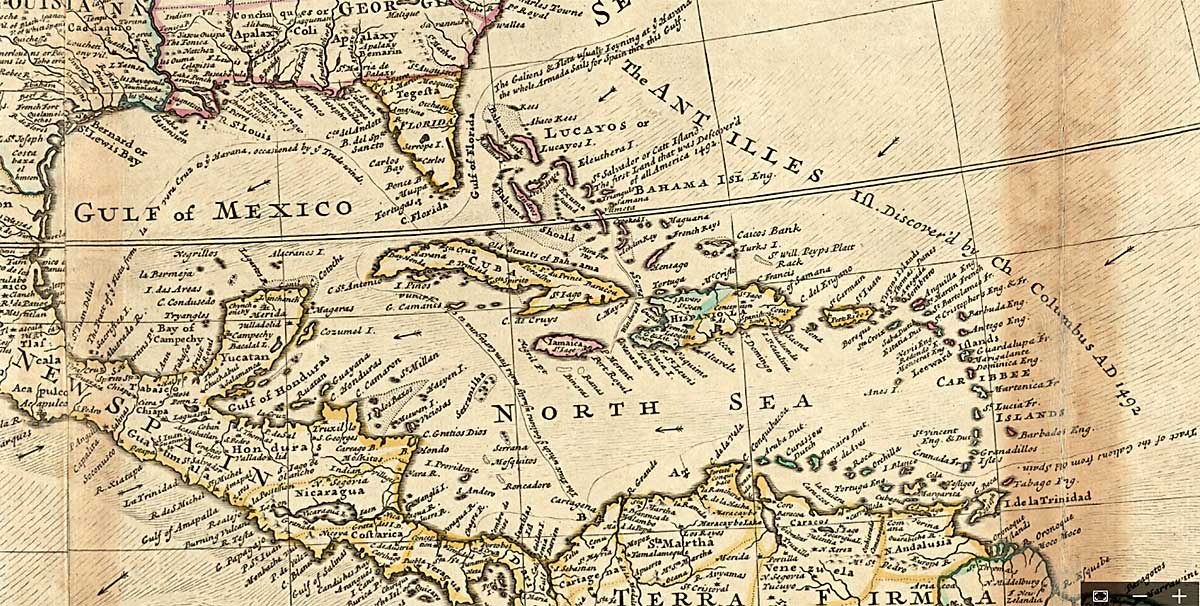
In the lower-right corner of the full map is an "Explanation" which not only narrated the route of the Spanish silver fleet as it made its way through the Caribbean and the Gulf of Mexico but also provided information on where the fleet anchored, how long, and the process by which mined silver made its ways from Peru and Mexico to the ships. The larger map traced the route of the galleons. One can see the routes on the main map as lines with text along them explaining more about the route and destinations. From the Atlantic they led across the northern edge of South America and then from Columbia (Cartagena) and Mexico (Vera Cruz) to Cuba (Havana) and then back to the Atlantic between Florida and the modern-day Bahamas.
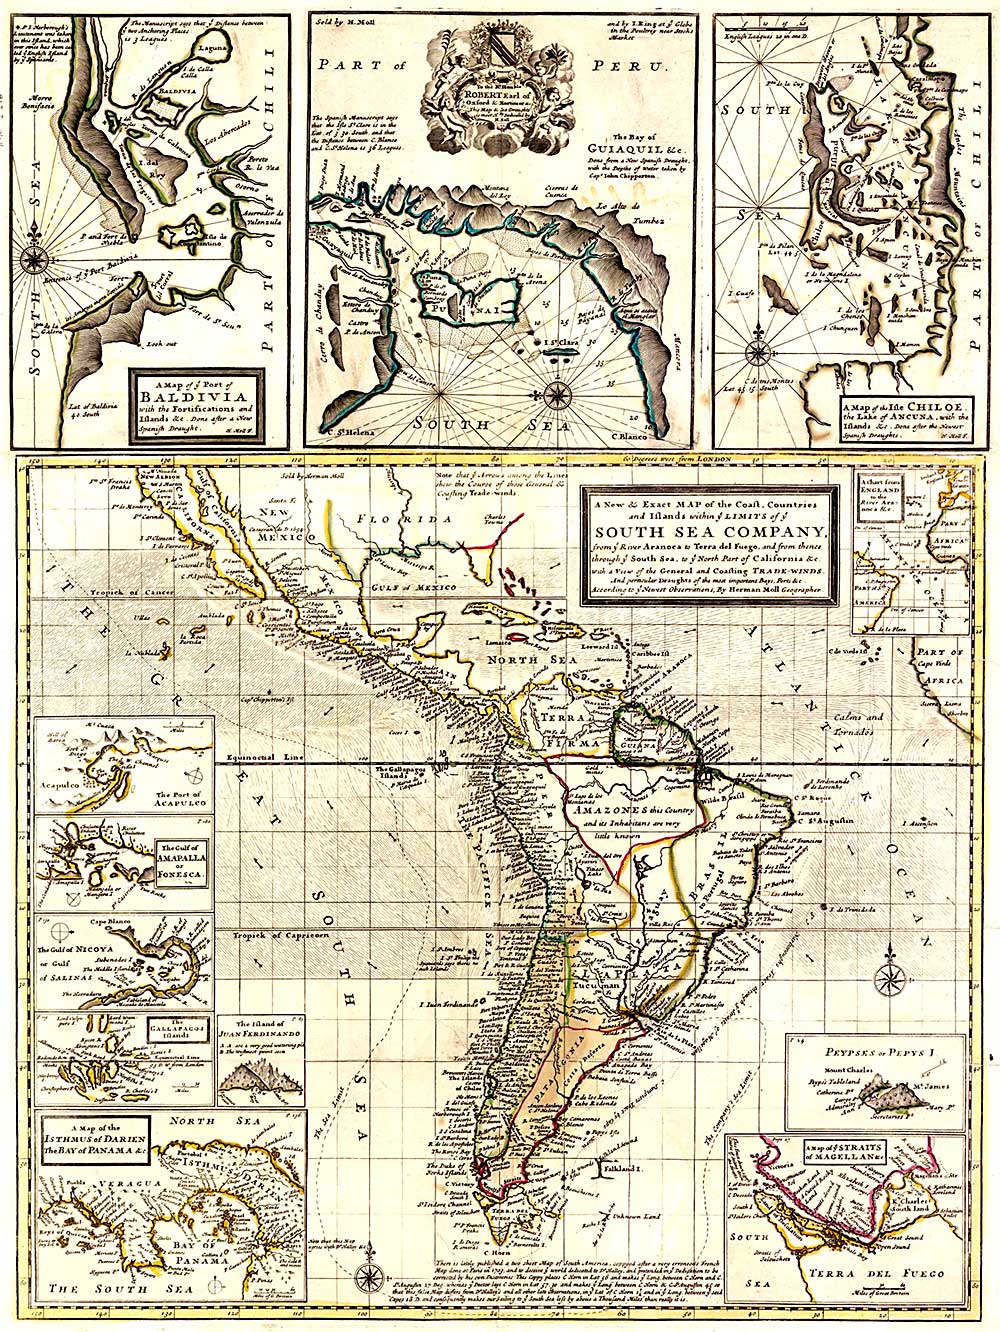
The vessels followed the trade winds (which Moll engraved on the map as faint broken lines and arrows) and ocean currents into the Caribbean, through the Gulf of Mexico, and out via the Gulf of Florida. The map showed the port cities of the Spanish West Indies as explicitly networked spaces with distances mediated by oceangoing vessels. Moll's map was an invitation to British privateers to disrupt that network and seize the silver bullion that Spain's galleon fleet transported. With this context of the larger map in mind, we are in a better position to interpret the charts of the Spanish ports that Moll engraved. While a discussion of the chart of Acapulco properly belongs in the next section of this article since it is a Pacific Coast port and its rendering on Moll's "Map of the South Sea Company" is identical to the chart on his map of North America, Moll's charts of Spain's Caribbean port cities highlighted their highly fortified nature after decades of predatory attacks and increased privateering during the War of the Spanish Succession. Cartagena was the first major port where the treasure fleet anchored and Moll's chart of the port city and its hinterland revealed a fort (Bochachica) at the mouth of the Bay of Cartagena, forts (St. Croix and St. Lazare) near the city on its bay (harbor) side, and a city itself looking formidable as a completely walled urban center on its bay and seaward sides. The 1701 geography characterized Cartagena as a provincial capital with "a safe and very spacious Harbour. It was also walled the first of all the American Towns, and is well fortify'd with two Castles; nevertheless it was taken and laid waste by the English, and again by the French in the late War, A. D. 1696. Moreover, this City is the Port for the [treasure] Ships that arrive in these Parts from Cadiz, and the adjacent Territory is stor'd with Balm, Rosin, and several sorts of Gums."23 The 1709 geography went even further in its encouragement of buccaneering: "The Building of the Town is very handsom [sic] . . . The Harbour is reckon'd one of the best in the World; And is the place where the Galleons lie at Anchor, and receive their Lading from Porto-Belo; and hence they sail to the Havana in Cuba, in their Way to Europe. In 1697, Monsieur de Pointi with a Squadron of French ships took this City, after a formal siege and carry'd off a very considerable Mass of Treasure."24 If it made it out of Cartagena, the Spanish treasure fleet's next destination was Portobello in Panama. Like his other charts, Moll's plan of the Bay of Portobello indicated the harbor's depth in fathoms, sand bars, and underwater hazards and the two forts (la Mare and Grande) that surrounded the mouth of the bay that led to the city – useful knowledge for a ship on a "cruising" voyage seeking plunder. The 1701 geography noted that "Porto Belo, i.e. The fair Port, [has] a safe and capacious Harbour, and two well fortify 'd Castles built on an Hill . . . It is a considerable Mart-Town, and famous for its Fairs and Markets, but it was taken and pillag'd by the English and French in 1668."25 To further entice the adventurous, the 1709 geography added a long description of the way large loads of silver bullion made their way from Peru to Portobello overland from Panama City.26 Moll's chart gave privateers and other sailors a good idea of the bay's shape, size, depth, defenses, and orientation in case they were interested in trying their hand at pillaging the unwalled port city. Leaving Portobello, part of the Spanish fleet sailed to Vera Cruz and part navigated directly to Havana where it waited for the ships to rejoin the flotilla. Moll's chart of Vera Cruz identified the location of a fortress on the offshore island of San Juan Delua, the "road" between the mainland and the island where ships would anchor to unload goods and load silver and other commodities, and sand bars and underwater hazards around the island. The city's harbor was on the island and the 1701 geography painted an ambivalent picture of Vera Cruz: "Its Harbour is . . . capacious, but not very safe for Ships to ride in, by reason of the Rocks: The Town also wants Walls, and the Air is unwholesome." The book went on to clarify that it was the port of the vice-regal capital, Mexico City, and handled most of the passenger traffic and export and import trade between Europe and New Spain.27 The later geography added that "the North Wind drives the Sand so, that it almost overwhelms the Houses, and has actually buried the Walls of the Town, which now People constantly ride over. The Bastions and other Works are irregular, and too far distant from one another." Due to these conditions, it claimed that merchants and wealthy individuals stayed "no longer than they have Business, or Ships come in."28 Only workers and the poor resided in the city more permanently. The final port city on the galleon fleet's route through the West Indies was Havana and Moll's inset chart showed a port city that had strong natural and human-created defenses. Three fortresses (El Moro, Water Castle, and Mesa de Maria) flanked the narrow entrance channel at the mouth of which Moll engraved a lighthouse-like structure and which he labeled "A High watch Tower." A fourth citadel further down the channel guarded the city proper which, in addition, was protected by a high stone wall. The 1701 geography noted that it was the seat of the governor and "a most strongly fortified Mart-Town, with the most renowned and most capacious Harbour, of all Northern America . . . where the Royal Fleet is usually fitted out, and continues in that Station till the Season of the Year, and the favourable Winds seem to promise a propitious passage to Spain."29 The 1709 geography, written at the height of the War of the Spanish Succession, made the following observations: "The Harbour encloses two sides of the City, and is safe against Enemies and Weather, so deep that the greatest Ships Anchor at a small Distance from the Shore. It is defended by three castles." It then detailed the size and number of the ordinance and bastions in each of the forts and concluded "that of late Years the Fortifications of this Place have been very much improv'd."30 The port city's visual layout in Moll's chart, with depths and sand bars indicated, and the verbal descriptions in the geographies provided vital information to privateers considering an assault on the harbor or on selected ships as they left the protection of the bay and the fortresses. If one wonders why Moll engraved the plan views of these ten ports, the answer for the Spanish port cities seems relatively easy: they were the main stops on the route of the Spanish silver fleet in the West Indies and would be of major strategic and economic interest to British elites and gentry, the main customers of Moll's maps, during the course of War of the Spanish Succession and in its aftermath. Privateering was big business and that provides one reason for the inclusion of New York and Port Royal: they were notorious pirate havens.31 Military and economic reasons also argue for the inclusion of St. John's and Charleston (and Port Royal) since they were in conflict zones with other empires (French and Spanish respectively). Boston was the largest port city in British-controlled North America and consequently had great economic importance to stabilizing and legitimizing British claims to the continent. Pacific Coast Ports of the Americas While it may not always be apparent, Moll seemed to favor the left side of his maps as the space for his vignettes and views of port cities. Perhaps he favored the visual weight of that space because readers of European languages start on the left and move their eyes to the right as they read a text or an image. He engraved the original "Map of the Limits of the South Sea Company" as an insert for a 1711 book that promoted the South Sea Company to investors and laid out Spanish "Strength and Riches, where they have been and may be attack'd; where the Indians are in a Disposition to receive the English, if the intended Settlement is attempted by Expulsion of the Spaniards, and maintaining an friendly Correspondence with the Indians; which in all Cases is of the last Importance."32 The Company's strategy was to form alliances with the native peoples of western South America, gain access to the gold and silver mines of the region, and cut the Spanish middlemen with their reputed 3000% mark-up out of the trade in English manufactures.33 The Spanish hoped to keep the British out of direct trade with Spain's American colonies and, in the absence of a treaty or a specific trade agreement, any direct British trade with Spanish American ports was an officially hostile act and the insets expressed the company's hostile intention. The three views at the top of the map were added in 1712 as Moll prepared the map for individual sale and for inclusion in his atlas.34 These views were gargantuan and took up about a third of the final map sheet. All appear to be drawn to the same scale since Moll only provided one scale of miles (at the top of the far-right Chiloé inset). These insets of major port cities and littorals on the Pacific coast of North America looked more like the charts Moll engraved for the "Map of North America" than the port city insets he engraved for his "Map of the East Indies" but they had features not found on either of those map sets.
The reason for the differences had mainly to do with the map stock he used: Spanish charts captured and copied by English pirates, privateers, and buccaneers (Bartholomew Sharp and Basil Ringrose in 1682, Lionel Wafer, and William Hack around. 1700, and John Clipperton around 1705).35 Moll kept Spanish names for most of the geographic features and his insets ciculated the contraband geographic knowledge that British entrepreneurs and privateers needed if they were to subvert Spain's mercantilist policies successfully.
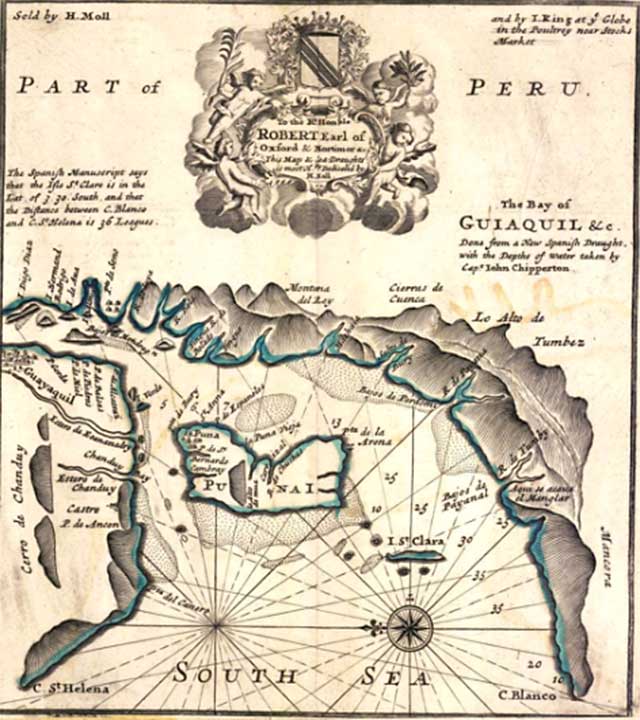
The inset "A Map of ye Port of Baldivia" appeared in the upper-left hand corner of the larger map. The view was a sea chart with rhumb lines of constant bearing radiating out from fixed points. It represented littoral space differently from Moll's East Indian insets and combined an orthogonal view (straight down) with a profile view of cliffs, shoreline, and islands as if one were approaching the shore and bay by ship. It gave littoral spaces more prominence than the views in the East Indies map. The entrance to the bay was in profile view which would help sailors identify the entrance from the sea. Forts guarded either side of the entrance: a large one on the southern point (St. James) and a smaller one named Fort de Niebla on the northern point. A third fort, St. Severin, lay just inside the entrance to the south. Two forts were on Isle de Constantino. The fortified city of Baldivia occupied the tip of a peninsula in the northern part of the bay. A final fort was on English Island due west of the city. The map showed eleven rivers, indicating abundant fresh water sources for (British) interlopers. Besides highlighting littoral features, the chart provided the port's latitude and specific anchorages represented by (what else) anchors: one (Port del Corral) just inside the bay's entrance and surrounded by forts and the other near the middle of the bay. A note by Moll states that "The Manuscript [map] says that ye Distance between ye two Anchoring Places is 3 Leagues." The 1711 book commented that the city of Baldivia was a very noted port that the Spanish laid out in a grid pattern with fine houses and two large market places and it described in great detail the forts and ordnance which guarded the port from attack by Europeans at sea and Araucanians on land.36 It noted that the Spanish desired consumer goods, the native peoples wanted guns and ammunition, and all commodities commanded a high price paid in gold.37 The book insinuated that the British could ally with the Araucanians to overthrow Spanish rule and assume control of the port's trade and its fertile hinterland and gold fields.38 Moll's inset view of the Baldivia littoral encouraged such an insinuation. The map of the Bay of Guayaquil resembled the chart of Baldivia in style of presentation with a compass rose, rhumb lines, an orthogonal view of the ocean, and profile views of the mountains surrounding the bay. Guayaquil was in the upper left (northeast) corner of the chart. Moll informed the viewer that the chart was "Done from a new Spanish Draught, with the Depths of Water taken by Capt. John Chipperton." The depths were in fathoms and knowing the bay's various depths would facilitate sailing in and out of the bay's southwest channel. Moll let readers know in another notation that the mouth of the bay was 36 leagues wide.
The book mentioned forts around the city but considered them "not strong"39 and they did not grace the map. It noted that at Punta de la Arena, "all Ships bound into the River of Quiaquil [sic] anchor, and must wait for a Pilot, the Entrance being very dangerous for Strangers." Moll placed an anchor on the chart at that spot off the southwest corner of Puna Island. The geography continued that the pilots were Native American and "The Tide runs very strong all about this Island, but so many different ways, by reason of the Branches, Creeks, and Rivers which run into the Sea near it, that it casts up many dangerous Shoals on all sides."40 Moll engraved them along parts of the shore and Puna Island. The book maintained that the bay could accommodate large ships and the town, a provincial capital and major Pacific seaport, exported timber, hides, cocoa, and tropical drugs and was seized and ransomed by English privateers in 1687.41 Provincial authorities were often willing to trade despite official prohibition but the British could not always be trusted to draw a clear line between trading and raiding in the Americas.
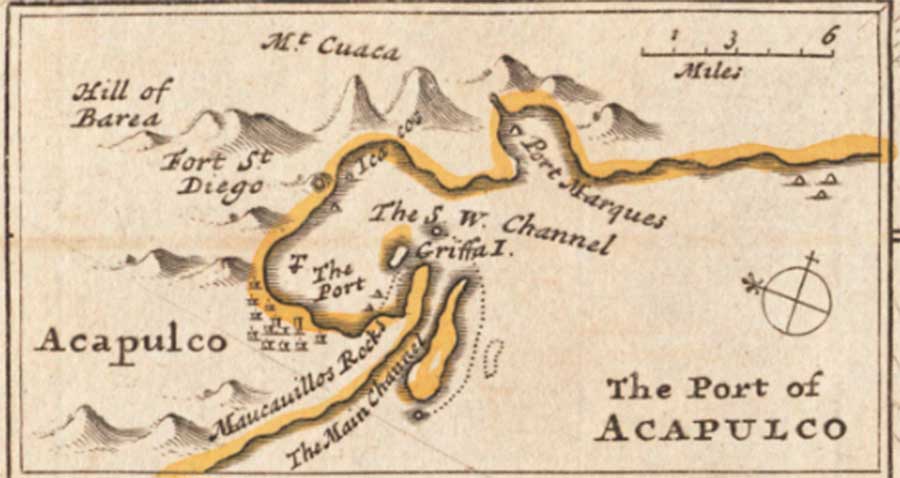
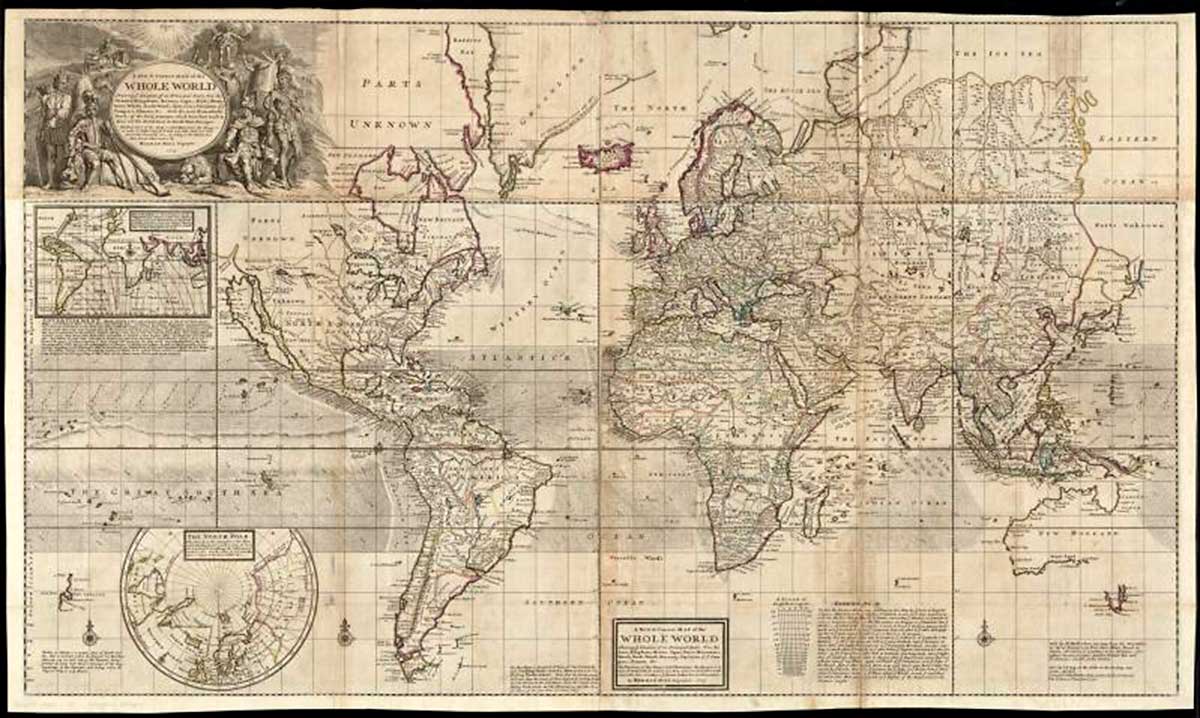
Acapulco was one end of a long-distance trade route that spanned the Pacific Ocean between the Americas and the East Indies, bringing this article back to the region where it began. The small inset showed a plan view of the bay of Acapulco and a slightly oblique view of the surrounding mountains. The port lay protected by a peninsula on the south side of the bay. A fort (San Diego) lay on the north side of the bay guarding the approach to the port. Moll indicated a Main Channel and a Southwest Channel as the chief access routes to the bay and the place of anchorage with an anchor symbol. The book reckoned it "a pretty large town . . . [with] a very commodious Port for the Reception of Ships, and so large that some hundreds may safely ride in it . . . You must enter with the Sea-wind, and go out with the Land-wind. The Manila Ships pass by the Westermost Channel. The Lima Ships by the South-West."42 The book provided a detailed description of the size and shape of the bay, its latitude, its and the town's defenses (only some of which appeared on Moll's inset), where ships anchored, and concluded "'Tis the only Place of any considerable Trade on all the Coast, there being little or no Traffick by Sea, on all the N. W. Part of this vast Kingdom."43 In keeping with its focus on buccaneering and the seizing of Spanish "prizes" as a way to pay South Sea Company investors and to provide additional motivation for investment, the book discussed the three well-armed merchant ships that annually dropped anchor in Acapulco, two sailing to and from Manila and one sailing to and from Lima. All were highly sought prizes although pirates had limited success in seizing them.44 The vessel from Lima carried quicksilver, cocoa, and silver; it waited for the ship from Manila with its of load silks, calicoes, muslins, spices, porcelain, and other East Asian commodities that it would take back to Peru; the ship from Acapulco mainly carried silver ingots to purchase East Asian commodities in demand in Spanish America and Europe. The book explains in great detail the wind patterns in the Pacific Ocean that allowed the galleons to traverse it45 and, as he did in many of his regional maps, Moll engraved the pattern of prevailing trade winds along coasts and out over the ocean. They are visible as the darker areas stretching across the Atlantic and Pacific Oceans well above and below the Equator on his "Map of the Limits of the South Sea Company." The final map we will examine tied all of the other maps in the atlas together. In doing so it also showed how the world ocean connected the port cities engraved on the regional maps. "A New & Correct Map of the Whole World" Moll engraved two world maps for his atlas The World Described. One he based on a Mercator projection which was the projection preferred by sailors since it allowed them to determine lines of constant compass bearing. As on his other maps, he highlighted wind patterns by engraving shallow, broken lines close together, creating the darker areas stretching across the world's oceans above and below the Equator. In this area he engraved heavier arrows to show the direction of prevailing winds, whether the trade winds of the Atlantic and Pacific or the monsoon winds of the Indian Ocean and South China Sea.
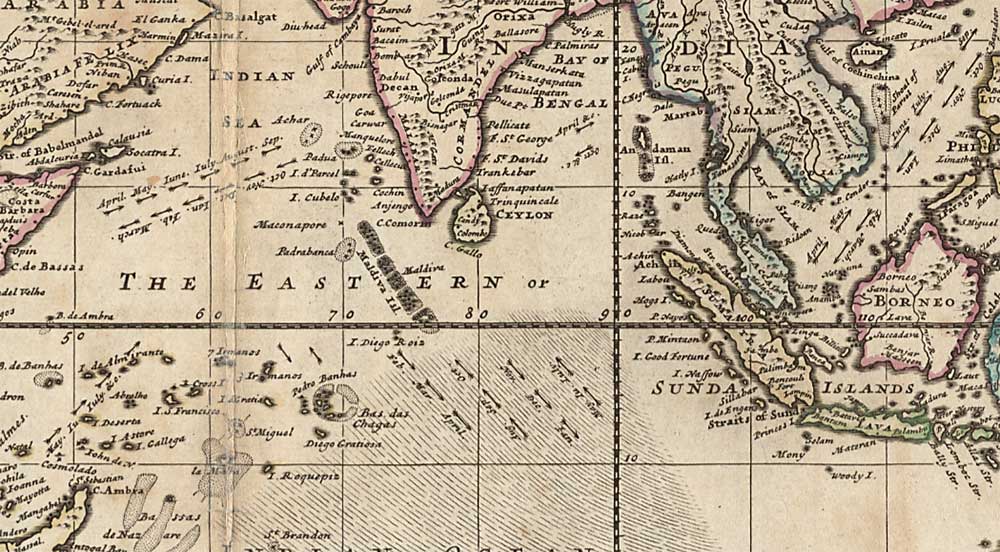
That is, Moll's world map offered viewers insight into the dynamic weather systems that connected the disparate port cities of the Indian Ocean basin to each another and to ports farther afield: he engraved the monsoon wind patterns on the map and noted how their direction shifted with the seasons so seamen and merchants could plan their voyages accordingly to reach their intended port city destination. (See Image 16.) The monsoon in the western Indian Ocean, the Bay of Bengal, and the South China Sea blew in a northeasterly direction from April to September and then reversed itself to blow southwest from October to March while the monsoon in the southern Indian Ocean below and across the equator had a slightly different pattern: it blew in a northwesterly direction from May through October and blew southeast from November to April. Since the trade winds of the Atlantic and Pacific blew in a circular gyre, he only had to indicate their overall direction as an aid to navigation.
One can see these trade winds incised in the bottom third of Image 17. However, knowing wind patterns was only one part of being able to navigate long distances at sea. In the late seventeenth century Sir Edmund Halley tested his theory that the readings of a magnetic compass varied from true north or true south depending on one's location at sea. Navigating around the world was not a matter of simply setting course based on a compass reading and a map using a Mercator projection. He tested his theory of magnetic variation on a voyage from the North to the South Atlantic at the turn of the eighteenth century and published his findings in 1701. Moll engraved an inset on his world map based on Halley's original "General Chart of the Variation of the Compass" which was the first chart to use isogonic lines, lines which maintain the same degree of compass variation, say 25 degrees, along its length. Since Moll's map was a world map, he needed to supply the comparable information for the Pacific Ocean.
Halley never ventured into the Pacific so Moll relied on the readings taken by the buccaneers Woodes Rogers and William Dampier as they circumnavigated the globe between 1708 and 1711 in search of Spanish galleons to plunder. Their readings appeared just below the chart as circles with the four points of the compass on a line that stretches from Cabo San Lucas in Baja California west across the Pacific to Guam. Conclusion As David Armitage noted, before the nature of connections within the British Empire could be conceived, they first had to be perceived46 and Moll's cartography explicitly laid out those connections for British elites to see but it did more than that. It contextualized British empire-building within the larger global political economy dominated by European and Asian empires in a way that, with its visual and spatial elements, contemporaries could readily grasp. Moll's maps, engraved mostly for British elites who were his most important clients but also commercially popular, show how Britain's leading mapmaker consciously represented oceans as aqueous highways that facilitated commercial and political contact between every region of the world. Moll highlighted the harbors, coasts, and port cities of the Americas and the East Indies because these were areas whose natural resources and manufacturing wealth the British hoped to tap but the maps showed that the British were not alone and had to reckon with the presence of other powerful states and empires in their strategic economic and political gambit. Every world history textbook discusses the mercantilist era and its imperial conflicts with different emphases. For instance, the most recent edition of Traditions & Encounters highlights the technologies of European exploration including ship construction, navigational instruments, knowledge of wind and currents, trade and conflict in early modern Asia, European commercial rivalries in the seventeenth and eighteenth centuries, Spanish, French, and English empires and colonial conflict in the Americas, mining in the Spanish empire, the fur trade in North America, and the formation, operation, and decline of the Mughal Empire, among other topics and issues.47 The latest edition of The Earth and Its Peoples emphasizes the extractive colonial economy of Spanish America (along with an inset on silver refining at Potosí), the English and French colonies in North America, capitalism and mercantilism in the forging of an Atlantic economy, the political foundations and regional challenges to the Mughal Empire, and the maritime world of the Indian Ocean.48 The geography books cited in this article provide important contextualizing details but Moll's maps, as accessible primary sources, engage students' minds and imaginations in ways that even the best textbooks do not. His maps contain scores of interesting visual details that teachers can probe in the classroom.49 With an assist from contemporary geographies and the history of cartography, this article clarified important symbolic and visual clues for interpreting each map and its insets. Those clues highlighted the importance of port cities for Britain's involvement with the far reaches of the world and for altering the global economic and political status quo to Britain's advantage. Teachers can work with students to decode these clues in classroom assignments50 and use Moll's maps in much the same way he intended: as visual learning aids that related the dispersed geographic parts of European (but especially British) empire-building to the geopolitical and geophysical conditions of the globe as a whole in the seventeenth and eighteenth centuries. Teachers at the college or the secondary school level can adapt the examples and interpretations presented in this article to the specific content they teach about the mercantilist era of world history that stretched from the early sixteenth century to the late eighteenth century. Dr. Alex Zukas is Professor of History in the College of Letters and Sciences at National University in San Diego, California. He is a social and economic historian with specialties in working-class and environmental history, European imperialism and colonialism, and the history of cartography. He has participated in two National Endowment for the Humanities Summer Institutes: "Reading Popular Cartography" at the Newberry Library in Chicago and "Empires and Interactions across the Early Modern World, 1400–1800" at St. Louis University. He studied at the Ruhr-Universität in Bochum, Germany, and holds a Ph.D. in Early-Modern and Modern European History from the University of California, Irvine. His recent publications include "Making the Geographic Turn: Researching and Teaching Early-Modern British and World History." The Middle Ground Journal (Forthcoming 2016) and "The Cartography of Herman Moll and European Views of Muslim South Asia, 1700–1730." Special Double Issue: European Encounters with Islam in Asia. Journal of World History 25, nos. 2–3 (June/September 2014): 311–339. |
||||||||||||||||||||||||||||||||||||||||||||||||||||||||||||||||||||||||||||||||||||||||||||||||||||||||||||||||||||||||||||||||||||||||||||||||||||||||||||||||||||||||||||||||||||||||||||||||||||||||||||||||||||||||||||||
|
|
||||||||||||||||||||||||||||||||||||||||||||||||||||||||||||||||||||||||||||||||||||||||||||||||||||||||||||||||||||||||||||||||||||||||||||||||||||||||||||||||||||||||||||||||||||||||||||||||||||||||||||||||||||||||||||||
|
Notes
1 Dennis Reinhartz, The Cartographer and the Literati: Herman Moll and his Intellectual Circle (Lewiston, N.Y.: The Edwin Mellen Press, 1997), 1–2, 17; Mary Sponberg Pedley, The Commerce of Cartography: Making and Marketing Maps in Eighteenth-Century France and England (Chicago: University of Chicago Press, 2005), 13, 33. 2 David Armitage, The Ideological Origins of the British Empire (Cambridge: Cambridge University Press, 2000), 146–148, 155, 159–161. 3 This article will not deal with the nature of port cities as objects of historical study. Readers interested in that topic should read Franklin W. Knight and Peggy K. Liss, eds., Atlantic Port Cities: Economy, Culture, and Society in the Atlantic World, 1650–1850 (Knoxville: University of Tennessee Press, 1991); Haneda Masashi, Asian Port Cities, 1600–1800: Local and Foreign Cultural Interactions (Singapore: NUS Press and Kyoto: Kyoto University Press, 2009) (which has chapters on Batavia, Madras, and Surat), More generally on many of the themes raised in this article see Pieter Emmer and Femme Gaastra, eds., The Organization of Interoceanic Trade in European Expansion, 1450–1800 (Aldershot: Variorum, 1996). 4 Herman Moll, The World Described; Or, A New and Correct Sett of Maps: shewing The Kingdoms and States in all the known parts of the Earth, with the principal Cities, and most considerable Towns in the World. Wherein the Errors of the ancient Geographers are corrected according to the latest Observations of Travellers, as communicated to the Royal Society of London, and the Royal Academy of Paris. Each map is neatly engraved on Copper by Herman Moll, Geographer and printed on two Sheets of Elephant-Paper; so that the Scale is large enough to shew the chief Cities and Towns, as well as the Provinces, without appearing in the least confus'd. And to render these maps the more acceptable, there is engraved on several of them what is most remarkable in those Countries (London: 1715). Moll's maps in this atlas were generally 60 x 100 cm (ca. 24 x 39 inches). The "Map of the Limits of the South Sea Company" was 43 x 47 cm (ca. 16 x 18.5 inches). 5 Reinhartz, Cartographer, ix and 1–2. 6 David Woodward, "English Cartography, 1650–1750: A Summary," in The Compleat Plattmaker: Essays on Chart, Map, and Globe Making in England in the Seventeenth and Eighteenth Centuries, ed. Norman J. W. Thrower, (Berkeley: University of California Press, 1978), 186. 7 A System of Geography, or a New & Accurate Description of the Earth In all its Empires, Kingdoms and States. Illustrated with History and Topography, and Maps of every Country, Fairly Engraven on Copper, according to the latest Discoveries and Corrections, by Herman Moll. To which are added Alphabetical Index's of the Names, Ancient as well as Modern, of all the Places mention'd in the Work. And a General Index of Remarkable Things, Part the Second (London: Timothy Childe, 1701), 57. 8 Thesaurus Geographicus: or The Compleat Geographer. Part the Second. Being the Chorography, Topography, and History of Asia, Africa, and America. Faithfully extracted from the Best Modern Travellers, and most esteem'd Historians: and Illustrated with Maps, Fairly Engraven on Copper, according to the modern Discoveries and Corrections by Herman Moll. Third Edition very much Enlarg'd (London: A and J. Churchill, and T. Childe, 1709), 128. 9 System, 67. 10 System, 66. Thesaurus added nothing of note regarding Goa. 11 K. N. Chaudhuri, The Trading World of Asia and the English East India Company, 1660–1760 (Cambridge: Cambridge University Press, 1978); Om Prakash, European Commercial Enterprise in Pre-Colonial India (Cambridge: Cambridge University Press, 1998), 141–142, 161–164, 186–194, 247–253, 301–305. 12 System, 80–81. 13 Thesaurus, 100. 14 System, 68–69; Thesaurus, 114. 15 System, 57; Thesaurus, 128. 16 James D. Tracy, ed., The Political Economy of Merchant Empires: State Power and World Trade, 1350–1750 (Cambridge: Cambridge University Press, 1991), especially the chapters by M. N. Pearson, Thomas A. Brady, Jr., Geoffrey Parker, and K. N. Chaudhuri. 17 Stephen J. Hornsby, British Atlantic, American Frontier: Spaces of Power in Early Modern British America (Hanover: University of New England Press, 2005) 28–31. 18 System, 162; Thesaurus, 239. 19 System, 165; Thesaurus, 240. 20 System, 175–176; Thesaurus, 244. 21 System, 186. 22 Thesaurus, 277. 23 System, 200. 24 Thesaurus, 284. 25 System, 200. 26 Thesaurus, 282–283. 27 System, 181. 28 Thesaurus, 261. 29 System, 184. 30 Thesaurus, 276. 31 P. Bradley Nutting, "The Madagascar Connection: Parliament and Piracy, 1690–1701," The American Journal of Legal History 22, No. 3 (July 1978). See also Robert C. Ritchie, Captain Kidd and the War against the Pirates (Cambridge, MA: Harvard University Press, 1986) and Simon Smith, "Piracy in Early British America," History Today 46, 5 (May 1996). 32 A View of the Coasts, Countries, and Islands within the Limits of the South Sea Company. Containing an Account of the Discoveries, Settlements, Progress and Present State; together with the Bays, Ports, Harbours, Rivers, &c. The Various Winds and Soundings; the Product, People, Manufactures, Trade and Riches of the several Places: viz. From the River Aranoca to Terra del Fuego, and from thence through the South Sea to the farthest Bounds of the late Act of Parliament. o which is added, an Account of Former Projects in England for a Settlement, and the Accomplishment of the Last in the Establishing the New Company, with a List of the Commissioners Names appointed by Her Majesty to take the Subscriptions. Also some Observations on the several Voyages that have hitherto been Publish'd. The Whole Collected from the best Authors, as well as manuscripts as Printed. Illustrated with a General Map, and Particular Draughts of the most Important Places; By Herman Moll, Geographer (London: Printed for J. Morphew near Stationers Hall, 1711), 209. 33 View, 210. 34 Gillian Hutchinson, "Herman Moll's View of the South Sea Company," Journal for Maritime Research 6, 1 (September 2004): 103; Reinhartz, Cartographer, 121–122. 35 Hutchinson, "View," 36 View, 49, 53. 37 View, 50–51. 38 View, 58. 39 View, 112. 40 View, 108. 41 View, 110–112. 42 View, 196–197. 43 View, 197. 44 View, 199–200. 45 View, 198. 46 Armitage, Ideological Origins, 180. 47 Jerry Bentley, Howard Ziegler, and Heather Streets Salter, Traditions & Encounters: A Global Perspective on the Past, vol. 2, 6th ed. (New York: McGraw-Hill, 2014), 482–483, 489–494, 498, 541–548, 550, 614–616, 619–626. 48 Richard W. Bulliet, Pamela Kyle Crossley, Daniel R. Headrick, Steven W. Hirsch, Lyman L. Johnson, and David Northrup, The Earth and Its Peoples: A Global History, vol. 2, 6th ed. (Stamford, CT: Cengage, 2014), 452–554, 459–463, 482–487, 512–513, 518–521. 49 Researchers, teachers, and students can view digital versions of the maps used in this article. Using the search term "Herman Moll," all the maps in The World Described, plus many other maps engraved and published by Moll, are available online at the Boston Public Library Norman B. Leventhal Map Center at http://maps.bpl.org/. The maps can be greatly magnified to see the smallest details. The geographies are also available online. A System of Geography (1701) is available as a download in different formats (PDF, Kindle, ePub, etc.) at https://archive.org/details/systemofgeograph00moll. Thesaurus Geographicus Part II (1709) is available as a download in different formats at https://archive.org/details/cihm_15090. 50 See Alex Zukas, "Maps as Commodities in Modern World History," World History Bulletin XXVIII, 2 (fall 2012): 26–31, for ideas on how to help students decode Moll's maps as a classroom assignment. |
||||||||||||||||||||||||||||||||||||||||||||||||||||||||||||||||||||||||||||||||||||||||||||||||||||||||||||||||||||||||||||||||||||||||||||||||||||||||||||||||||||||||||||||||||||||||||||||||||||||||||||||||||||||||||||||
|
|
| Home | List Journal Issues | Table of Contents |
| © 2016 by the Board of Trustees of the University of Illinois |
Content in World History Connected is intended for personal, noncommercial use only. You may not reproduce, publish, distribute, transmit, participate in the transfer or sale of, modify, create derivative works from, display, or in any way exploit the World History Connected database in whole or in part without the written permission of the copyright holder. |